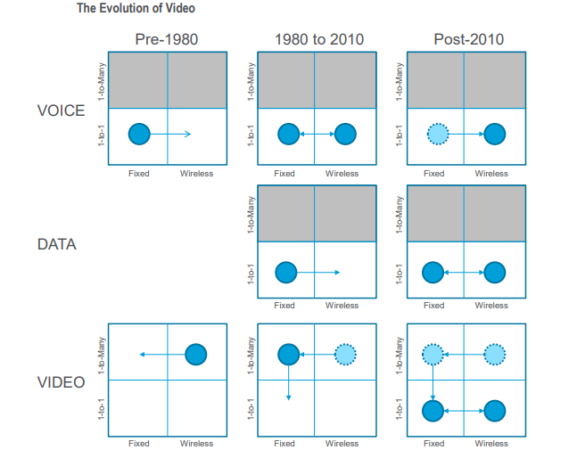
Over the last four decades, voice and data evolved from fixed to mobile applications. Mobile platforms allow you to use voice and data anywhere. TV and media started with a one-to-many platform and moved to cable TV, a fixed-line one-to-many platform. Nowadays, the video industry is migrating once again: one-to-one delivery through both fixed and mobile platforms.
When did the TV business start?
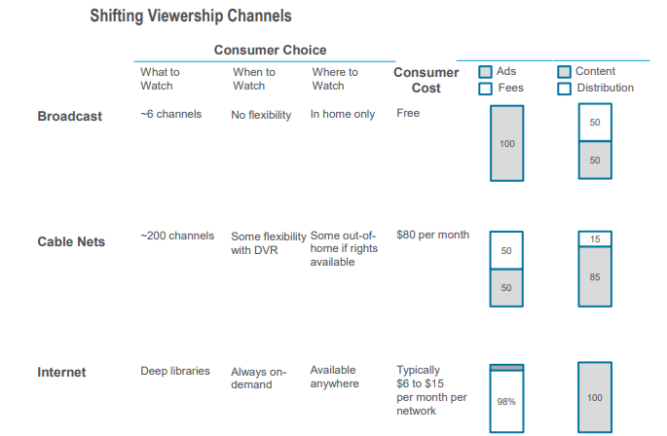
The television business was born in the 1940s. Initially, the content for consumers was free. The industry generated revenues from advertisements. Since distribution was relatively scarce, the networks paid the TV station owners to carry their content. Earnings were divided equally between the local TV station and the broadcast network. Because free-to-air (FTA) TV stations had limited broadcasting, entrepreneurs began to lay a coaxial cable with the intention to connect a coaxial wire into a TV station to expand the station’s range. Greater reach meant more ad revenues. Fortunately, these family-run cable firms laid down thick coaxial wires that had extra capacity for future usage. By the 1980s, media firms started to develop TV programming to use this excess coaxial capacity. The cable network business was born. The cable network business varied from the old TV model in two ways:
- consumers paid for the service
- the cable network kept the bulk of the ad revenues.
After that more households began to sign up for pay TV services and ratings for free broadcast TV began to fall.
In parallel, the internet was taking form. By the late 1990s, the cable industry realised that it could allocate a portion of its excess coax capacity to broadband Internet access. By 2008, Netflix began to adjust its business model from shipping DVDs by mail to delivering video content over the Internet. Since then, other services have followed Netflix’s lead. Today, there are about a dozen web-based video firms. They come in three flavors:
- First, there is the subscription video on demand (SVOD) players – like Netflix, Amazon, and Hulu. These firms give consumers library content and some original shows.
- Second, there are web-based firms that offer a linear feed of traditional cable network content. Today, Dish’s Sling and Sony’s Vue are in the market.
- Third, consumers can stream individual channels over the web. HBO Now, Showtime Anytime, CBS All Access and Viacom’s Noggin are all examples of the content firms offering their content directly.
The migration from cable networks to Internet video is a complicated process. It includes broadcast TV, cable networks, movie studios, advertising, TV production, book publishing, magazines, TV stations, consumer products, and video games. In the last seven years (2007 to 2014) cable networks accounted for 81{3fbfd6f1e6b19884051837dbbbebf333964dd5fac151615ffbd47b80e5ecc87a} of the revenue growth and 73{3fbfd6f1e6b19884051837dbbbebf333964dd5fac151615ffbd47b80e5ecc87a} of the EBITDA (Earnings Before Interest, Tax, Depreciation & Amortization) growth within the entire US media sector.
What are the Main Implications for Pay TV Firms?
Investors often say: “All I know is I want to own content. That’s where the value is.” There are two fundamental issues with this investment hypothesis.
- The content isn’t a king. We have never met an investor that requires to have a movie studio.
- Even if investors concentrate their attention on cable network content, there is a danger. The risk is that most cable networks are over-earning. If you run out and buy a stock that owns cable network content hoping to benefit from the rise of Netflix and Amazon, be careful.
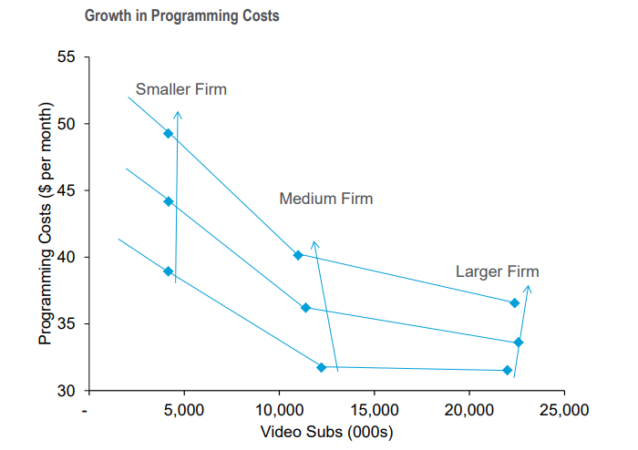
It turns out that programming spendings have been rapidly growing for small, medium and large pay for TV firms. The rate of growth has been a bit more bright for smaller firms relative to larger companies.
This phenomenon isn’t isolated to publicly traded cable firms. In effect, smaller pay TV firms get squeezed by the pricing actions of the media firms. As such, some cable firms are now shifting their strategic focus away from video delivery and pivoting toward broadband.
What are the Three Main Threats that Cable Networks Face?
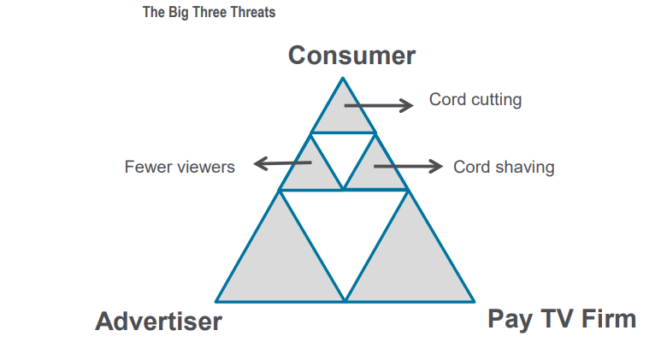
Traditional cable networks are now competing with new web-based entrants. It suggests cable networks face three distinct threats:
- First, at the consumer level, households can take advantage of web-based subscription (SVOD) services — like Netflix or Amazon — to reduce consumption of live TV. Consumers might also narrow the size of their traditional video package (cord shaving). Or, they might eliminate their pay TV subscription (cord cutting).
- Second, at the advertiser level, marketers may shift ad budgets away from the TV and spend more on web ads using firms like Facebook.
- Third, at the pay on the TV firm level, there emerge signs that some pay-TV distributors will break their distribution agreement with some content providers.
Of course, these three risks — from the consumer, from the advertiser, and the pay TV firms — are related. It’s better to see them separately.
The Consumer Threat
The consumer threat begins with a question: “How will consumer’s viewing habits change with the advent of SVOD platform?”
Nielsen is one of the leading providers of viewership data for the ad market.
Nielsen measures well three things:
- live TV content, VOD and DVR use;
- the use of the TV content on tablets and smartphones within seven days of the original air date;
- TV content on PCs.
But, there are three areas, where the content didn’t measure:
- bars, restaurants, gyms, and airports;
- content on a connected TV via devices like Roku or AppleTV;
- TV content on tablets and smartphones if the content is shown more than seven days after the original air date.
US viewers started to watch less live TV. The decline in traditional viewing is due primarily to a rise in DVR use.
The younger viewers shift their viewing habits more rapidly than older. As the population ages, it may forecast a structural shift in video consumption. Younger viewers concentrate more on the usage of the web.
The Nielsen data show that live linear viewing is falling because of high DVR usage and the rise of Internet video.
The Advertiser Threat
The Internet’s first victim was print advertising. All of the growth in Internet ad spending has come at the expense of print.
US print ads — including directories, newspapers, and magazines 3 peaked at ~$75 billion in 1999. Then, the print category spent about ten years with relatively muted growth. In 2009, print advertising began to contract. And, it’s unlikely ever to rise again. The level of non-print, non-Internet ad spending has been stable for about 10 years at the $100 billion levels.
The Internet is a more accessible way to advertise. And, of course, it influences the rates of advertising.
The Internet video is now beginning to show signs of strength. In the US, 2014 total video ad outlays consisted around $67 billion. The expenses divided into five categories: national broadcast, local broadcast, national cable, local cable, and web-based video. There are three essential observations over the last ten years:
- National and local broadcast advertising spending has remained flattish at about $32 billion
- National and local cable ad spending grew significantly over the previous ten years from about $31 billion in 2004 to $41 billion in 2014
- Web-based video is relatively new. It didn’t exist in 2004. But, by 2014 it generated over $4 billion in revenues
Advertising trends used to grow, but in the last decade, growth has slowed to the mid-single digit range.
Pay TV Provider Threat
The reason we think pay TV firms will drop content on pure economics. Pay TV firm’s watch video gross profits fall. If affiliate fees keep rising at 8{3fbfd6f1e6b19884051837dbbbebf333964dd5fac151615ffbd47b80e5ecc87a} per year while video ARPUs rise 3{3fbfd6f1e6b19884051837dbbbebf333964dd5fac151615ffbd47b80e5ecc87a} per year, video gross profit margins will reach zero by the end of the next decade. Pay TV firm’s watch video gross profits fall, while all cable networks are raising assistants fees at a high-single-digit pace. If we exclude the Regional Sports Networks, there’s a wide variance in the cost of cable programming.
A lot of investors believe the variance in affiliate fees stems from the difference in the view. They argue that viewership levels can be used to show the market for affiliate fees is inefficient. Sports costs drive affiliate Fees. Among firms that don’t spend on sports rights, Viacom is capturing far more in affiliate fees than rivals. Indeed, the market for US affiliate fees is remarkably efficient. This insight strongly suggests it isn’t apparent which piece of content a pay TV firm might drop. All firms seem to be ‘fairly’ priced.
Other problems of the pay TV firms include:
- Rating trends;
- Premium channel ownership;
- RSN ownership;
- Other free-to-air networks;
- Over-the-top offerings. Let’s look at each.
What is the difference between the US and European threats?
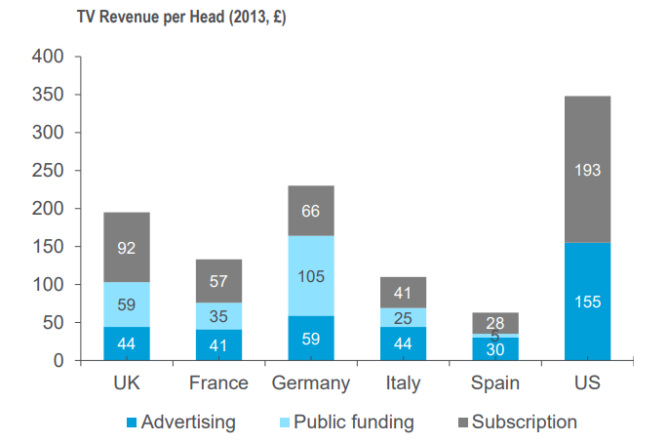
The European TV market is very different from the US. The European TV market dominates free on air while the US – by pay TV. Total TV costs per head — including subscription fees and advertising — is at least 1.5x higher in the US relative to the main European markets. Several factors explain the spending gap. First, ad loads are higher in the US. Second, pay TV penetration higher in the US. Pay TV penetration in the US is close to 80{3fbfd6f1e6b19884051837dbbbebf333964dd5fac151615ffbd47b80e5ecc87a}. In Europe, the highest level of pay TV penetration is in France at 56{3fbfd6f1e6b19884051837dbbbebf333964dd5fac151615ffbd47b80e5ecc87a}. Germany has the lowest level at 19{3fbfd6f1e6b19884051837dbbbebf333964dd5fac151615ffbd47b80e5ecc87a}.
Markets with high pay TV, Internet, and 4G penetration are most likely to experience more rapid changes in consumer viewing habits. Consumers take the opportunity to ‘unbundle’ their pay TV subscription or make use of OTT services via their connected TVs or other devices. It makes the UK and France appear most vulnerable. In the long run, it’s hard to see how avoid this transition in consumer behavior in developed markets around the world. The change in the level of 4G mobile penetration highlights the speed at which technology is allowing changing consumer habits.
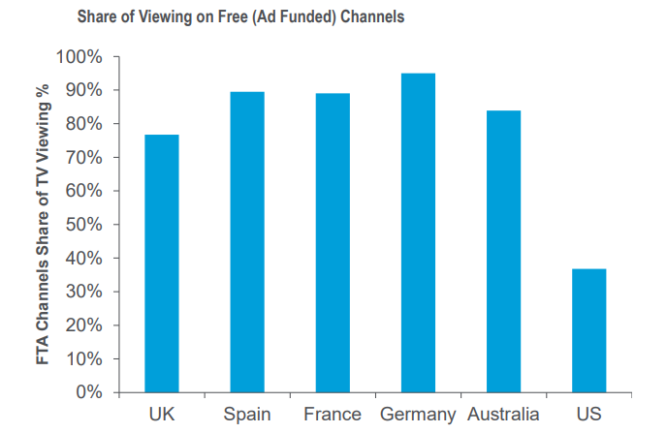
The other main difference between the US and Europe, driven by the pay TV/channel landscape, is that TV viewing time in Europe concentrates on the FTA channels.
The UK may face the highest risk among the main European markets, followed by France, Germany, Italy, and Spain.
Highlights:
- The migration from cable networks to Internet video was a significant breakthrough in the development of Moves and media industry
- Cable network content makes valuable the concept of “monetisation engine”
- Three risks face TV challenges: from the consumer point of view, from the advertiser, and the pay TV firms and they are tightly related



Recent Comments